

THE PROBLEM
There were complaints from users about the Reporting platform within the LMS. A stakeholder reached out and wanted to conduct exploratory research to better understand user concerns. The reporting platform touched all verticals in the B2B space and the research would need to understand, group, and make suggestions for resolution to the challenges.
We suspect that the issues experienced across the Reporting Platform were experienced by all verticals in the B2B space. Connecting with the various Product Managers would allow me to correlate pain points and report out on emerging themes across business sectors.
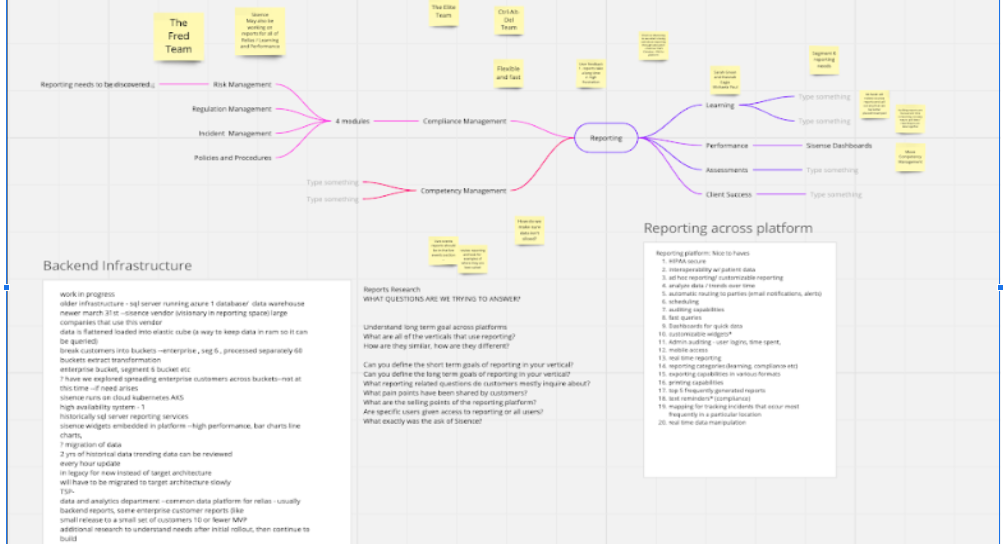
I identifed the various Product Managers, and scheduled time to speak with them and gauge their understanding of common concerns. I created a Miro board to document, and link the issues. Noticing trends and patterns in the discovery, I also looped in several additional participants from Engineering, Training, and Data Analytics.
The methodology for discovery was interview-style conversations with internal participants where I attempted to glean pain points, short and long-term goals of the verticals in the reporting space, and barriers to solutions.
From December 2022 to March 2023, eleven employeess lended their experience and acumen to participate in this study. The Relians included (1) Technical Trainer, (2) Data Analysts, (3) Product Managers, (4) Senior Product Managers, and an Engineering Manager. This primary research provided insight into user concerns that have been continually voiced through various channels as well as transparency into our current infrastructure supporting our reporting platform. The secondary research included a review of the tools and resources available for learning the platform for our users. The goal was to better understand the user journey and accessibility of the resources we offer. The overall research was designed to highlight reporting needs across verticals and to provide ideas and solutions to solve for challenges impacting our various populations of users.
Several key takeaways were uncovered throughout this research. The key takeaways revolved around the following:
Faster response times to report queries
The first key takeaway revealed in the research was a user pain point related to how long it can take to generate a report. Users have long complained that the queries can result in long loading times, or time outs with the system failing to display any results. Users need a more robust platform with a higher success rate for report generation and faster responses to their queries.
Infrastructure / Architecture refers to the back end systems that support the reporting platform that ultimately handle and supply the query results. To understand our current configuration, I interviewed P. Goldy and G. Serbula, members from the Engineering Team. They discussed our current infrastructure, and the planned changes that are underway.
Our current architecture utilizes one database for all of our customer data. When report requests are received, that one database has to be searched in order to supply the results to the query. Because of the massive amounts of records that must be searched, there can be a delay in returning search results to the user. Fortunately, our platform is currently updating the infrastructure that supports reporting across our platform. Our Engineering teams have sourced new infrastructure and architecture that will handle data differently and return the results of the queries or results much faster to our end users. This work is ongoing and set for rollout in the coming months.
Need for additional reports and functionality
The second key takeaway was uncovered by interviews with various PM’s and Senior Product Managers and a deeper dive into the platform to understand how a user would interact with reporting in the platform. This key takeaway identified the need for more reports and additional functionality within our reports. For the purposes of this research, new reports were grouped into categories. Those categories will be referred to as Proactive Management reports, Audit reports, and New Product reports.
Proactive Management Reports
Previous research has identified that many of our learners do not complete coursework on time. Our platform however, gives administrators very little ability to manage or oversee when learners are in jeopardy of missing completion deadlines. Our current platform reports largely center on course assignments and completions versus in progress and in jeopardy statuses. Our platform aIso does not easily allow administrators to review trends or identify pain points across their learning platform. In order for administrators to have more awareness of impending deadlines, trends, and problem areas, our platform could benefit from new reports that would provide this information to administrators.
Audit Reports
Audit reports was another category identified in research as a need in our platform. My interview with John Wolf, a Product Data Analyst with Relias, shed some light on the reasons users call for support. Wolf relayed that when many of our users call with a reporting related request, it is because they can not identify the necessary reports for auditing purposes. Relias can solve for these calls to our Connect Support team by creating a new category of reports or new reports labeled Audit reports. These reports should allow administrators to easily find the data they need to complete internal audits and external audits. Internal audits refer to the admins ability to complete a self-check of their organization’s learning objectives and goals. External audits are conducted by third parties who ensure compliance to state and federal regulations. The challenge presented with Relias creating audit reports for our customer partners is the lack of standardization in requests from auditors. We know little about what all an external auditor may request from our partner organizations. Additional research will be necessary to understand what external auditors typically need, so that we may build around those requirements. If we are able to better understand the requirements, and we can build reports or categories of reports for our customers, we can minimize the calls we receive to the Connect support center, empower admins to assist in completing audits, and make for a better experience with our platform.
New Product Reports
Next, several of our teams are in the process of buildouts of the platform. Because of the ongoing work in our Compliance and Competency Management teams for instance, new dashboards and widgets are being introduced in the reporting space. There are some new reports being designed, and more new reports might be necessary after the initial rollout. We will need additional research to better understand user needs beyond the initial rollout.
New Functionality
Along with the need for new reports for the afore mentioned business units, research also identified the need for additional functionality within our reports. This new functionality should include real time data manipulation, the ability to switch to graphical representations of data, additional sorting options, additional ability to collapse and expand data within reports, and interoperability of data within reports.
Real Time Data Manipulation
Real time data manipulation refers to the users ability to manage the filters in our reports in a way that allows them to change a filter and instantly see the impact of the filter change within a report. Currently our users do have the ability to manage filters after a report has been generated. However, it must be done on a separate page and the report must be regenerated once the filters are adjusted. If we can allow our users to manipulate the filters and see the real time updates which ensures that they do not have to continue to regenerate the report results, this provides a better user experience. Also, because of the infrastructure changes, it is a good time to explore this functionality. The new architectural structure should more easily handle additional data loads. (See Key Takeaway New Reports/Functionality for additional explanation and examples.)
Visual Aids and Graphics
Another expressed enhancement to make for a better user experience is allowing our users to switch views between text reports and visual aids or graphics to review their data. Reports can be lengthy text reports displaying tons of data. Allowing for graphical reviews of the data provides the user with control of how they want to see data, provides better opportunity to see trends, strengths, and weaknesses.
Additional Sorting
A review of of our reports revealed that some of our reports could also benefit from adding more sorting options. Because our reports offer so many data points, allowing users to manipulate and sort more of the data would be helpful. To exemplify, one of our most frequently generated reports, the Course Completion History Report, has a column entitled the Completion Type. This column distinguishes how the course was completed. Courses could have been completed online, in live format, or marked complete by an instructor. Unfortunately, there is no way to determine how many users completed this course online versus in a live format. Several of our reports offered columns where one or more could not be sorted. This added functionality continues to give admins control over how they want to see their data.
Expanding/Collapsing Data/Interoperability
Next, research suggested that the ability to collapse and expand data is a need for our users. Again with so much data in our reports, user need the ability to collapse and expand their data to hone in on what they are specifically searching for within their reports. This is also exemplified in the Course Completions History Report. This report list users and the courses they have completed during a filtered time frame. This report can have several lines or pages of course completions for one user. Our report, however, does not allow an admin to collapse or expand the results making it more difficult to manage the data without exporting.
Finally, there is also little interoperability between the data within the reports. Interoperability here refers to the ability to generate a report, but select links that access data from a different report. Our users would benefit from links within the reports that when selected, direct a user to additional data. Currently our users have no ability to drill down into data. Using the same example report, if an admin can see that several learners had difficulty in a particular course, then the listed course from the Course Completions History report could, for instance, be an interoperable link that allows the admin to quickly access the course, and perhaps even see which questions caused the most difficulty. Otherwise our admins would have to abandon their current report, then run a completely different report, perhaps the Item Analysis Report, to better understand where their learners struggled to answer questions. Interoperability and the ability to expand and collapse data within reports empowers our customers with easier access to the data they need.
Resources
The third major key takeaway was discovered by participating in new customer training and reviewing the reporting platform. The goal was to understand how difficult or hard it is to get acquainted with our reporting platform. Some of our customers purchase dedicated training as part of their onboarding. For those that do, reporting is the third of three webinars they are invited to attend. For customers who do not purchase training, they can also attend webinars. However, even with the dedicated training and webinars offered, users can have a more difficult time trying to understand all that the reporting platform offers. John Wolf, one of our Data Analysts, recounted during our interview, “One of the main reasons customers call Support is because they do not know which report to generate or how to filter reports that contain the data they need.” This takeaway identifies that some of our self help resources and training materials could benefit from reimagining how users need to access them, and what they should contain. There are also suggestions related to where these resources could live as well as how additional, new resources could be helpful for our users.
If a customer does not participate in the dedicated training or the webinars on reporting, they face challenges with finding sufficient detail in our self help resources. Aside from the resources mentioned, customers can access our Relias Connect online resources. While they have access, there are some gaps in our offerings available to them. First, our Connect link references “how to” guides that have recently been relocated, and at the time of the creation of this report could not be located. This causes misdirection for our users. Next, the Connect landing page has recently undergone a revision, however, one of the obvious missing self-help resources is one document or graphic that outlines each report, the data contained within it, and it’s best uses. Our platform does allow admins to click the title of each report to see a brief description of the report, but there are seven categories of reports and 32 reports contained within them. In essence, we are asking our users to dig into all of these reports to then select the most appropriate report for their purposes. This workflow is frustrating, and can be made easier with our help. The reference to the how to manuals should either be removed if they no longer exist, or it should direct a user to the how to manuals (for reporting in this case). I was able to find a video explaining how to generate reports, use the filters, and an explanation of the common reports, but this, too, required a concerted effort on my part to click several links, then use the search tool to find the video. Many customers may not spend as much time trying to locate the resource, and may abandon the process long before I did, and simply call the live Connect resources. We can minimize customer pain points, the number of calls to the Connect team, and user frustration to create happy paths or logical workflows to find our resources for our users.
Ultimately, all of the needs uncovered in this research speak to one central theme for our users: time. Reports that do no load or take long to do so waste time. Generating and sifting through several reports to get a clear picture of organizational learning wastes time. Too many clicks to find explanatory resources waste time. While the research identified several key short and long term needs in our reporting platform, all of them, if effectively addressed, work to save our customer partners valuable time. If we can resolve the concerns discovered through this research, we can provide our partners with more of this most precious commodity. As our users continue to express time as one of their main challenges, our platform should not require they spend their extra commodity to use our reporting platform.
Conclusively, addressing these short and long term needs will also modernize our reporting platform to meet the demands of today’s users. We should strive to ensure our platform is easy to learn and use.
The next section of the this report will outline recommendations. In order to facilitate some of the recommendations, additional research will be needed in the following areas:
New Reports/New Functionality
Resources
Based on the research findings, below are the suggested recommendations.
Infrastructure: Our back end infrastructure / architecture is directly related to the speed with which our users can generate a report and the results are returned.
New Reports/ New Functionality: Research identified several new reports for consideration that better provide administrators with the ability to proactively manage users and their training. New reports will be necessary for our new Compliance Management and Competency Evaluation verticals as well. Additionally, several of our reports need added functionality. This functionality includes interactive data manipulation, additional visual aids and graphics, and the ability to expand or contract the results.
Resource Material / Training: Research identified that reports resource information was not easy to find, task heavy to understand all of the report offerings, and trainings on reporting are not always purchased by our users.
What report data or requirements do users still need to have addressed after they have access to our new service offerings in Compliance Management and Competency Evaluations?

What are the real concerns? They were identified with the research efforts I completed: loading times for reports, new functionality, and better access to self-help resources. Work had already begun to update the backend infrastructure supporting the reporting platform. That work was to ensure less resolve time for reporting queries and solve for time outs experienced by our users. The Help and Support pages were reordered to better align users with the self-help documentation. Work also began to identify new reporting widgets, dashboards, and functionality.
This research study relied primarily on qualitative data from the various Product Managers to identify commonalities in experience. This study would have benefitted greatly from quantitative data from Client Care to highlight the common reasons users reach out for support. A follow-up study would have also been beneficial to capture and compare the rate of resolve time and time outs before and after the infrastructure changes, and changes to the self-help portal and resources.